01
Executive Summary
Hover to expand →01
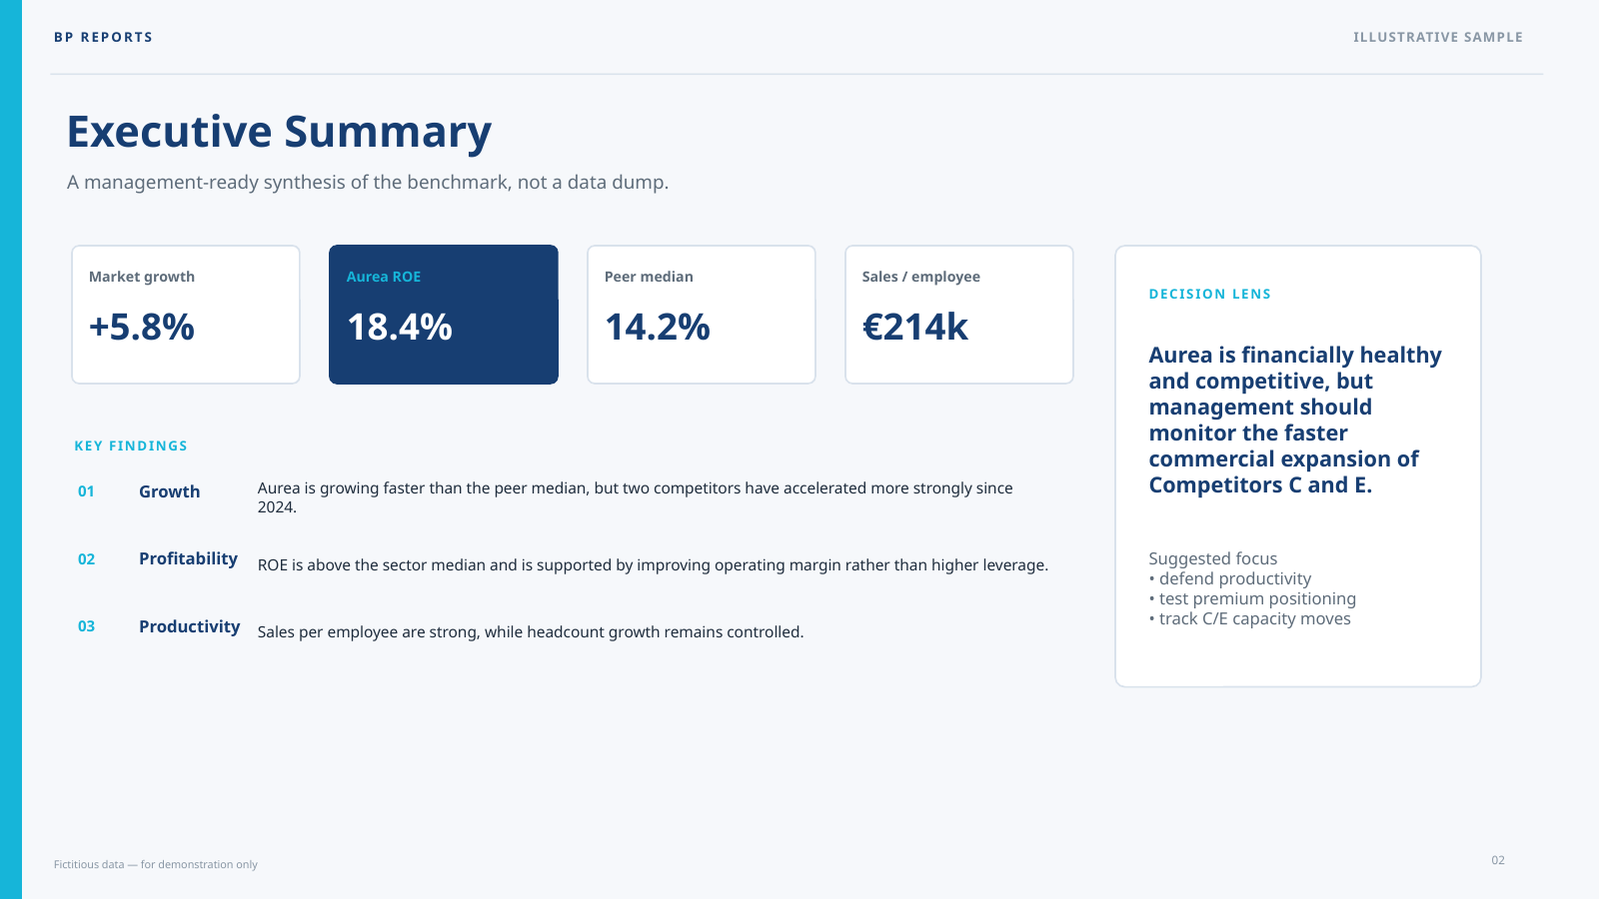
Sector context, key findings and the conclusions management should retain.
WHAT WE ANALYSEWe analyse and compare your company with its competitors to turn financial data and market movements into a clear, useful and actionable view.
Ratios and charts are the means. Our goal is to help you understand your competitive position, identify relevant signals and anticipate movements before making decisions.
MethodEach block adds a key piece to build a complete view of the competitive environment.
Sector context, key findings and the conclusions management should retain.
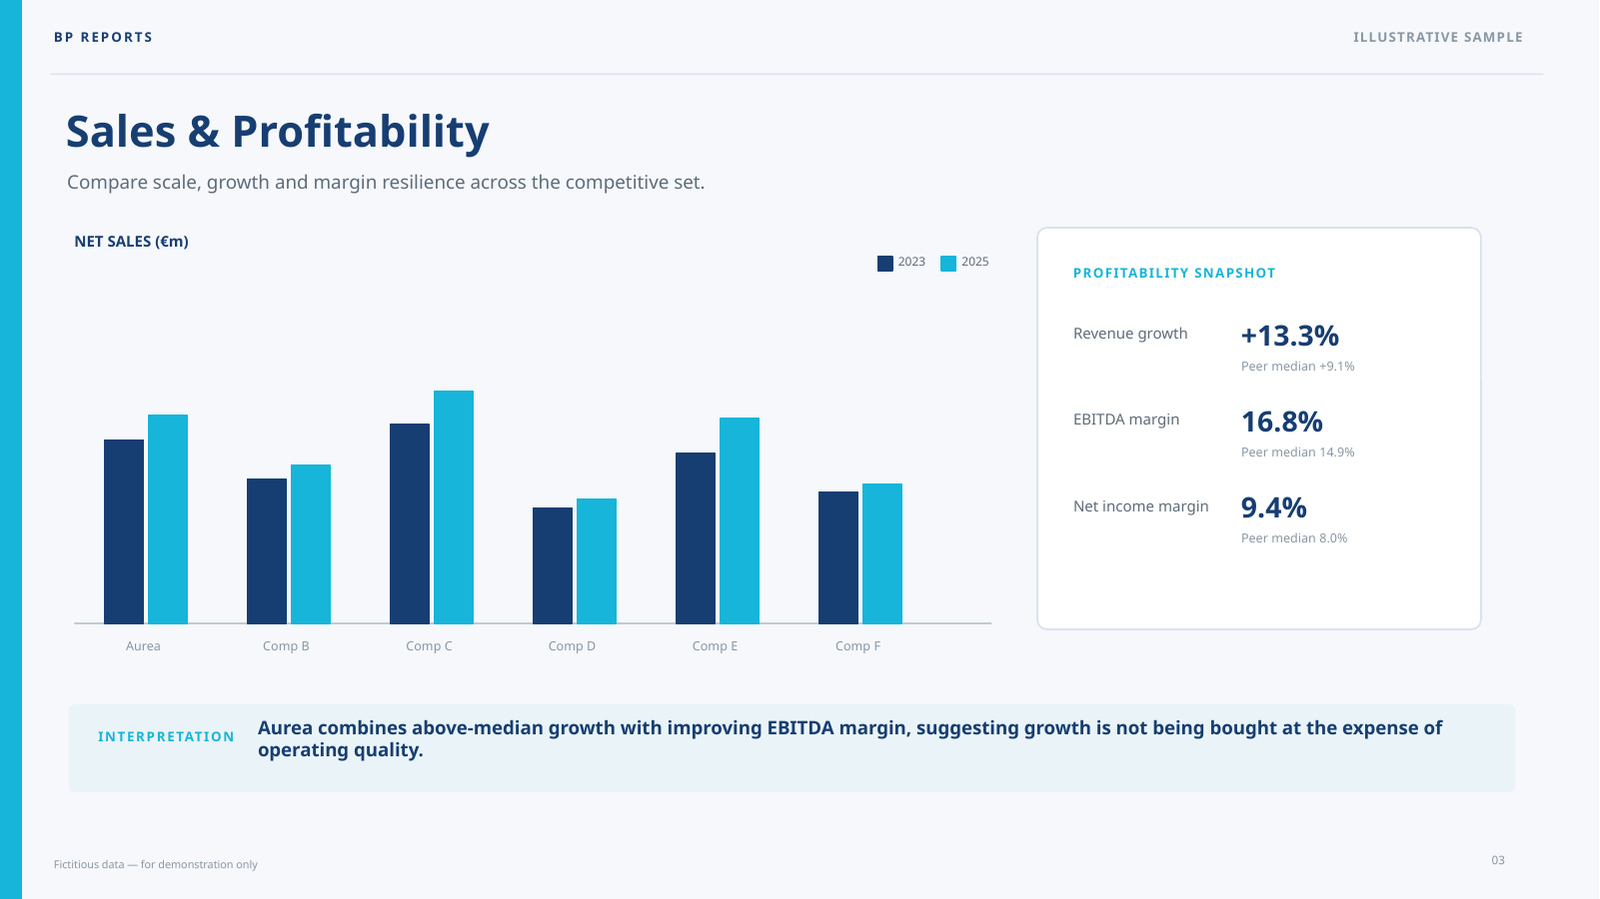
WHAT WE ANALYSENet sales, gross profit / net income, EBIT, EBITDA, growth and margins.
WHAT WE ANALYSEAsset distribution, equity, liabilities, leverage and liquidity.
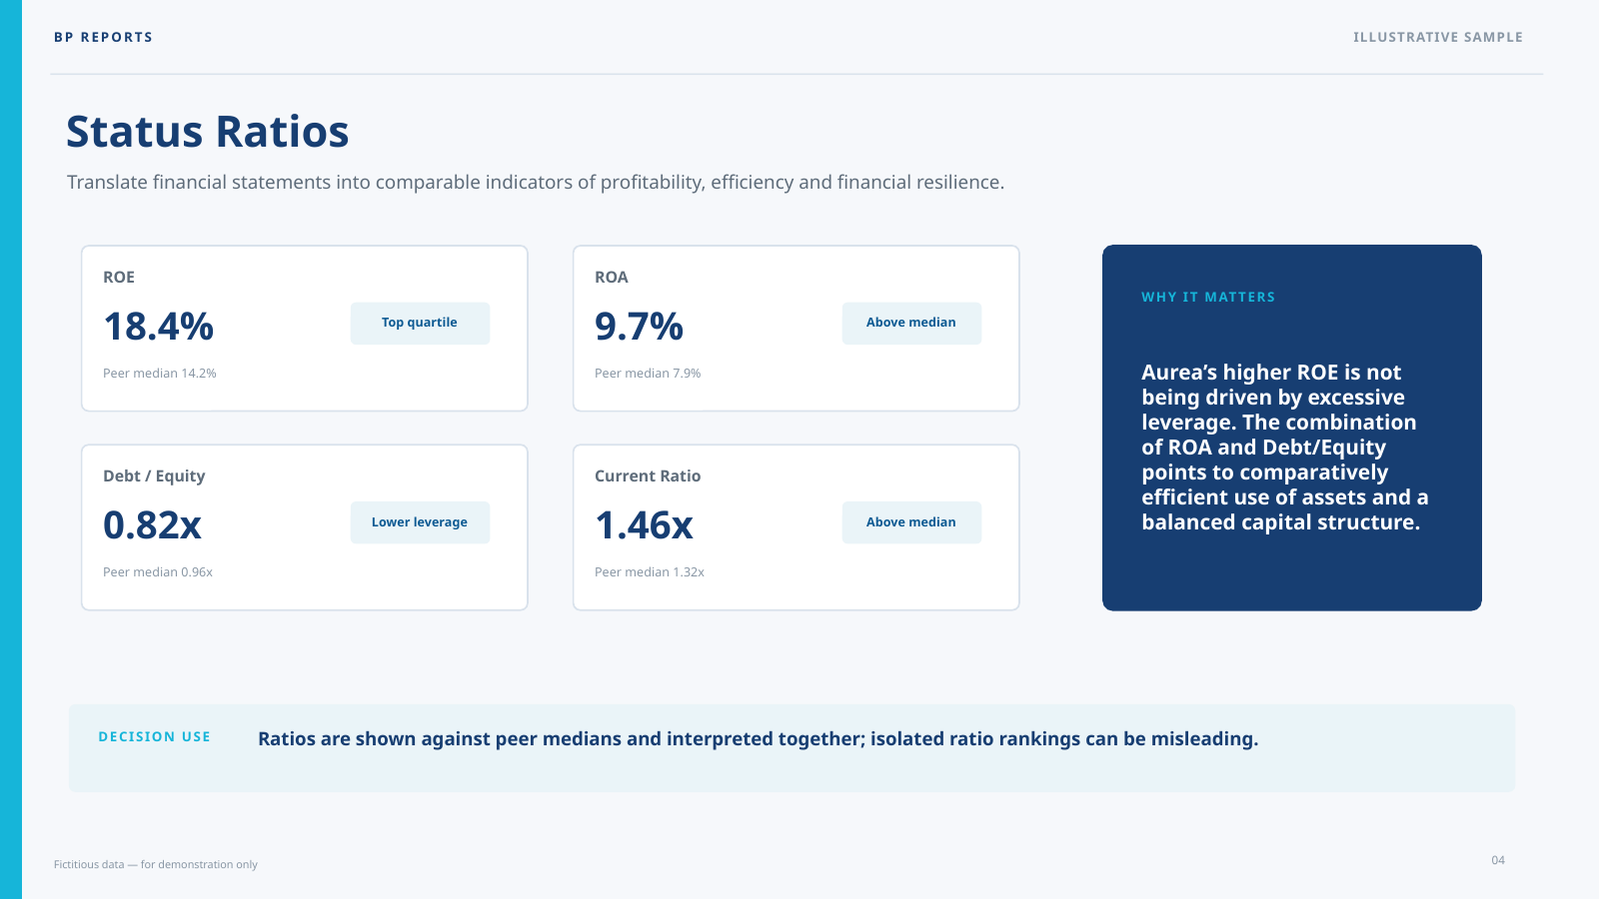
WHAT WE ANALYSEROE, ROA and selected ratios against the peer group and best references.
WHAT WE ANALYSEHeadcount, sales per employee, R&D investment and investment intensity.
WHAT WE ANALYSEAcquisitions, partnerships, launches, capacity, channels and other recent moves.
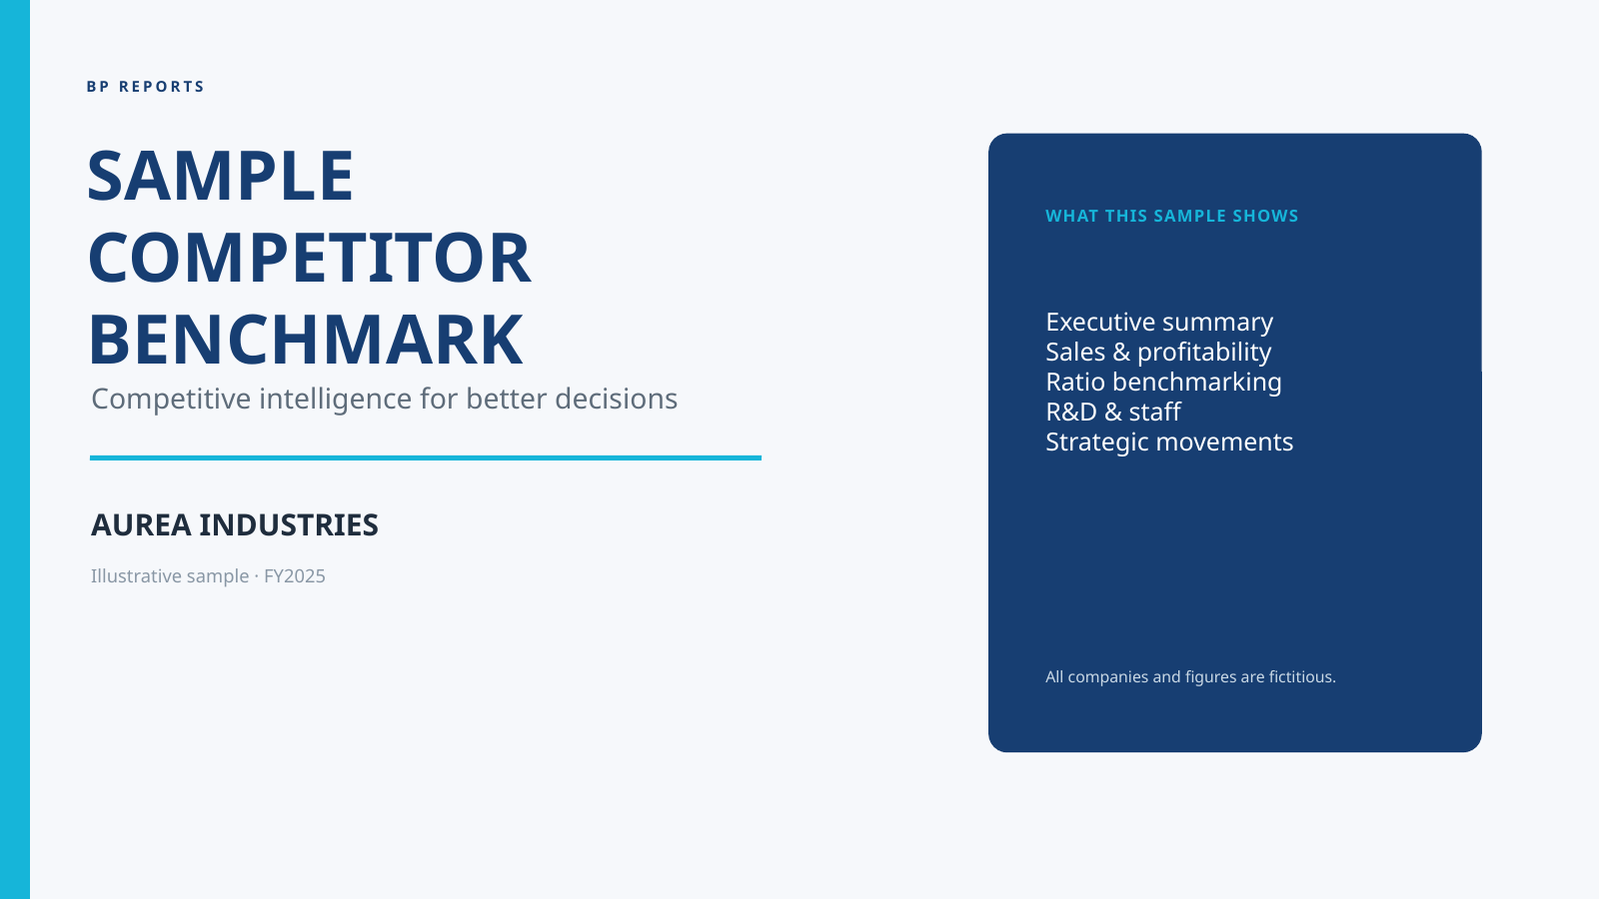
WHAT WE ANALYSEA short sample using fictitious data shows the level of detail, visual language and how we connect benchmarking with strategic implications.
We define the scope with you, collect and normalise information, compare the peer group and interpret the results before delivering the report.
Objectives, companies and key questions.
Financial statements, corporate sources and market information.
We align comparable data and definitions.
Patterns, advantages, risks and strategic moves.
Conclusions, presentation and final review.
Tell us which company you want to analyse, the market it competes in and the questions you want to answer. Together we define the peer group and scope.